Is 21% body fat good for a man?
21% is in the average category on the ACE chart for men (18 to 24%). On the ranges researchers matched to BMI, it is in the overweight range at ages 20 to 39 and in the healthy range at ages 40 to 79. It is leaner than about 76 in 100 US men aged 20 to 39 in the CDC survey.
Scanning is free. Full results from $4.99.
Average
- Essential fat 2 to 5%
- Athletes 6 to 13%
- Fitness 14 to 17%
- Average 21% 18 to 24%
- Obese 25% and over
Source: American Council on Exercise
21% by age
Healthy range at ages 40 to 59 and 60 to 79
- Ages 20 to 39Overweight range
- Ages 40 to 59Healthy range
- Ages 60 to 79Healthy range
Source: Gallagher et al., 2000
Leaner than about 76 in 100 at ages 20 to 39
- Ages 20 to 39 (average 26.1%)Leaner than about 76 in 100
- Ages 40 to 59 (average 28.6%)Leaner than about 91 in 100
- Ages 60 to 79 (average 30.8%)Leaner than 95 in 100
Source: CDC, NHANES 1999 to 2004
What 21% body fat looks like
21% sits between the 20% and 25% levels. Generated illustrations, not photos of real people.
-
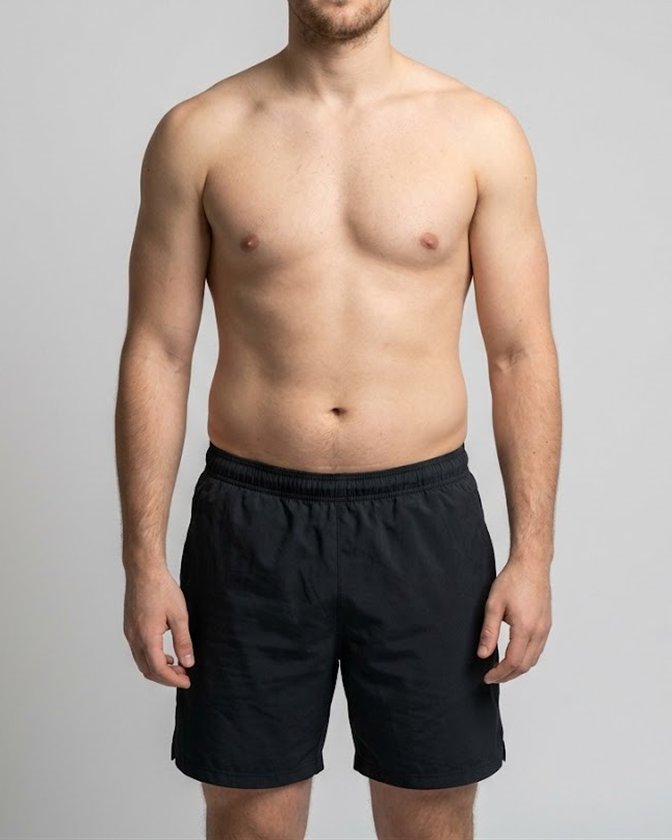 20% What 20% looks like
The stomach looks flat to slightly soft, with little or no ab definition. Some fat sits at the lower belly and the sides. Muscle shape still shows through a fitted shirt.
-
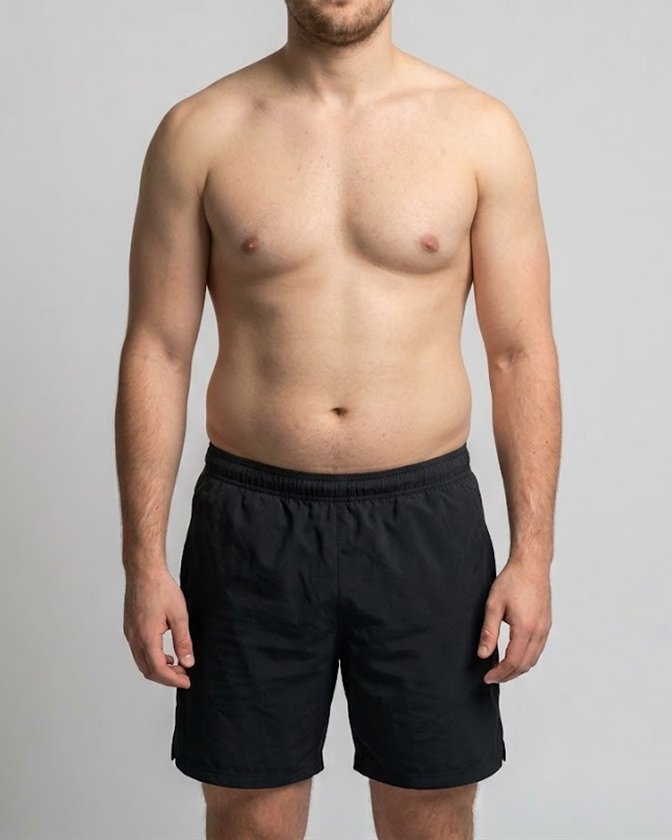 25% What 25% looks like
The midsection is soft, with fat at the waist, the sides and the lower back. There is no ab definition, the chest is softer and the face looks fuller.
21% body fat, answered
Is 21% body fat good for a man?
21% falls in the average category on the American Council on Exercise chart for men. On the ranges researchers matched to BMI, it is in the overweight range at ages 20 to 39 and in the healthy range at ages 40 to 79.
Is 21% body fat overweight or obese for a man?
The ACE chart for men starts the obese category at 25%, so 21% is below it. On the ranges researchers matched to BMI, overweight starts at 20% and obese at 25% for ages 20 to 39; 22% and 28% for 40 to 59; 25% and 30% for 60 to 79.
How does 21% compare with the average man?
In the CDC's national survey, 21% was leaner than about 76 in 100 US men aged 20 to 39, leaner than about 91 in 100 aged 40 to 59 and leaner than 95 in 100 aged 60 to 79. The averages for those ages were 26.1%, 28.6% and 30.8%.
What does 21% body fat look like on a man?
It sits between the 20% and 25% levels, which are shown in the pictures on this page. The same number looks different on different bodies, because of muscle, height, age and where fat is stored.
Find your own number
One photo is enough. No account needed to start.
Start your scan →Scanning is free. Full results from $4.99.
- Only you can see your photos
- Delete any time
- Sources
- American Council on Exercise. What are the guidelines for percentage of body fat loss? Link
- Gallagher D, Heymsfield SB, Heo M, et al. Healthy percentage body fat ranges: an approach for developing guidelines based on body mass index. American Journal of Clinical Nutrition, 2000;72(3):694-701. Table 4. Link
- Borrud LG, Flegal KM, Looker AC, et al. Body composition data for individuals 8 years of age and older: U.S. population, 1999 to 2004. National Center for Health Statistics. Vital Health Stat 11(250), 2010. Link
- These ranges are general guides. Bodyscanly gives estimates, not medical advice.